By David Nelson, CFA
Gordon Gekko – “This is your wakeup call pal. Go to work.”
It’s 6:30 am Wednesday, January 1st 2014 and I can’t get my mind off Gekko’s call to Bud Fox in the movie “Wall Street.” Obviously, I didn’t make it to Times Square last night, so I decided to start off the year by hitting the ground running. Let me share some reflections on 2013, how we got here and why I think the ride isn’t over.
If this was the Chinese New Year it would be called the “Year of the Taper.” Investors, portfolio managers and the media had a myopic obsession with the Fed’s every move. The markets were rattled in May at the first mention that Ben & Co. we’re thinking of rolling back the $85 Billion per month in bond purchases. We started the year with a 10 year treasury yield of 1.86%. In just 12 short months, rates rose 63% pushing the 10 year yield to just north of 3%. Despite what many believed would be an insurmountable headwind, the S&P 500 beat government debt by the widest margin since 1978.
Obviously, for balanced accounts it was the equity component that delivered the return. Best comment I heard this week was from Lawrence Glazer, managing partner at Boston’s Mayflower Advisors who said, “The more colorful your pie chart, the worse you did.” However, we also know that unless you’re under 40, putting all your assets in equity isn’t prudent or smart. Just ask anyone who was in that situation as we entered 2008.
Taper Fear
The nagging fear for investors is how fast will the Fed remove stimulus and how will equity markets react? I think we should take the Fed at their word. I expect some removal at almost every meeting and that they will stick to their data dependent strategy. The biggest challenge for the Fed will be to manage expectations and make sure the continued rise in rates is orderly.
The Bull / Bear Debate
As the bulls and bears enter the arena the battle will center on many themes in 2014. Valuations, margins, interest rates, the Fed and Washington will all be talking points throughout the year on your favorite news channel.
Valuations – The Fed Model (Click Chart to Enlarge)
 Every investor has their favorite way to measure valuations. Some like to look backwards and others look forward. While I look at dozens of data points, I often go back to the Fed Model to gain some perspective. Looking at valuations in a vacuum isn’t of much use. I believe it’s important to view equity valuations against competing asset classes. The Fed model looks at equity risk premiums to help determine if markets are under or over-valued. There are lots of complex formulas for Risk Premium but I like to KISS. (Keep It Simple Stupid) I look at earnings yield (Earnings divided by Price) vs the 10 Year Treasury Yield. Simply put, I take the earnings yield of the S&P 500 and subtract the 10 year treasury yield. Anything north of 2% and I’m comfortable. As you can see in the chart below the risk premium is declining as a result of rising rates and slow earnings growth but still in the green.
If you look on the left side of the chart you can see that the risk premium during the internet bubble was actually negative, not a good sign and a warning of overvaluation. The Fed model of course wasn’t of much use in 2008 as that was more a credit event.
Forward S&P 500 Multiple 1976-2015 (Click on Chart to Enlarge)
 Let’s look at valuations from another perspective. Our good friends from Goldman Sachs provide the next chart. As you can see, even though we’ve had a big multiple expansion in recent years we aren’t that far away from the average of the last 35 years. I’ll make my argument on why that can push higher shortly.
Margins – “IT’S DIFFERENT THIS TIME” (Click on Chart to Enlarge)
 For many hedge fund managers the data point that has kept them in the bear camp is a belief that margins have peaked and therefore must revert to the mean. This would be followed by falling stock prices and markets creating the basis of their short thesis. Merrill Lynch Strategist Savita Subramanian has put together an excellent retrospective of margins over the last 46 years.
As you can see margins slowly declined from the late 60’s bottoming around 1991. From that point to the present the trend has clearly been up. What’s interesting here is that the rise in margins over the last 20 years coincides with the rise of information technology. This is the single data point that has trapped bears for the last 4 years. I have no idea if margins will continue to expand. More than likely they won’t but I don’t believe info-tech falls into the same category as industrials and utilities. Information technology reduces the largest cost facing most industries. EMPLOYEES. Good for corporate profits but not so great for employment. You’re all waiting for me to say it so here it comes. “IT’S DIFFERENT THIS TIME!”
Inflation
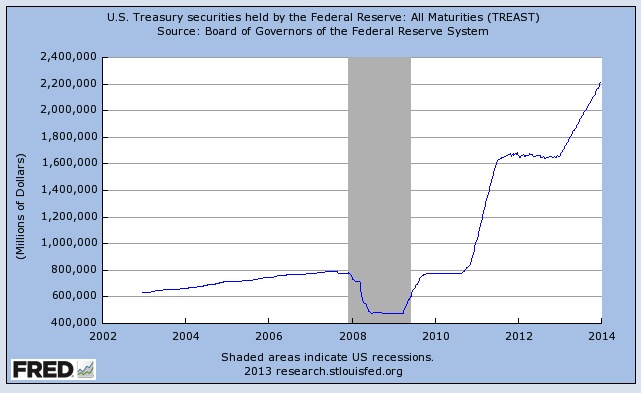
One of the biggest concerns for equity and fixed income investors is always inflation. Gold investors have been pointing to the Fed as an eventual source of hyper-inflation due to the massive expansion of their balance sheet. The charts below seem to tell a different story. Just at the point where the Fed’s balance sheet started to go parabolic in late 2012 with the implementation of its latest QE program, Gold accelerated its waterfall decline. The hyper-inflation many pointed to never materialized. I fail to see how that argument gets any better for gold bugs now that the Fed has started to exit.
Fed Balance Sheet (Click on Chart to Enlarge)
Gold Weekly 2011-2013 (Click on chart to Enlarge)

Sentiment – Merrill Lynch Sell Side Indicator (Click on Chart to Enlarge)
 Another rallying point for the bears has been that investors are just too bullish. Admittedly there are a lot more bulls since I first wrote the “Road to 1500” at the start of 2012. However, there’s still a lot of data to suggest that there are plenty of bears in the woods. Again, Merrill Lynch Strategist Savita Subramanian’s Sell-Side indicator seems to show that many are still underweight equities which could fuel more upside. She goes on to say that many on the Buy-Side (Mutual & Hedge Fund Managers) are still in the bunkers with overweights in defensive names and higher than normal cash levels.
2014 Projections
In recent appearances on CNBC & Fox Business I’ve laid out my projections for 2014. My base case projection is still for 7% equity returns based consensus growth in earnings for 2014. Current consensus is $117 in S&P earnings up from the $109 this year. 7% would get us to about 1980 in the S&P (SPX).
 However, as I’ve also pointed out, I can make a strong case for a target of 2100 in the S&P based on the multiple expanding to 18x. I strongly believe the US is on a path to energy independence, possibly as soon as 2020. Oil, natural gas, alternatives and yes even coal will assist in that effort. As you can see in the chart we crossed a critical milestone in 2013. We are now producing more energy than we are importing. That has enormous implications not just for our economy but for the multiples we pay for risk assets as this good news acts very much like a peace dividend. The removal of the Mid-East Oil price threat is a dream very few were talking about just a few years ago.
More Good News – The ISM Manufacturing New Orders component is still expanding.
(Click on Chart to Enlarge)

What if I’m Wrong?
Let me say right here, these are projections and predictions. Could I be wrong? Absolutely! Will there be corrections along the way? You can count on it. However, if I’m wrong it will more than likely be on timing rather than direction. I think we’ve entered a secular bull market that could run several more years.
What keeps me up at night?
All the things I can’t quantify. Military conflict, policy mistakes, natural disasters etc. all play a role in market performance. I’m greatly concerned about what is taking place in the East China seas between China, Japan and the U.S. Policy mistakes in this resource rich area of the world could easily have a ripple effect on markets.
Potential Surprises
Given how far some stocks have come during 2013 we just might get a head fake to kick off the start of the year. A quick rotation out of some of the names that worked best into laggards like utilities, energy, gold and yes even bonds. Just around the time investors have re-positioned themselves into the new leadership markets will go back to the secular growth stories that got us here. It’s important to have a perspective that looks out more than just a few weeks or months.
Washington
Finally, Washington has to get their act together. I’m speaking to both sides of the aisle here. We need to make progress on entitlement and tax reform. We have to address our uncompetitive corporate tax structure. The corporate cash levels that continue to build outside the U.S. will never come home unless we address this issue. Eventually that money is going to be put to work. Where that happens, is our choice.
Alpha Select Portfolios – The Good, the Bad & the Ugly
Realized Gains & Losses
For the year there were quite a number closed positions. There were more than 20 positions closed with realized gains of more than 20%. Too numerous to mention in this forum but some of the standouts included Comcast (CMCSA) +27%, Blackrock (BLK) + 35%, Yahoo (YHOO) +45%, Facebook (FB) + 38% & Walt Disney (DIS) +53%
As a rule we attempt to cut losses in any position that approaches 10%. Only one got away from us, Air Methods (AIRM) on a negative earnings announcement with a loss of (-27%). There were 4 others that had realized losses between (-10) & – (14%). They included Continental Resources (CLR), Valueclick (VLCK), Chicago Bridge & Iron (CBI) & Magnachip (MX)
Click Here to view all closed transactions for 2013
Unrealized Gains & Losses
Of the 27 positions currently in the Alpha Select Portfolio only 3 are in the red. Delta (DAL) & Amgen (AMGN) are both down (-3%) and Canadian Pacific Railway (CP) is down (-1.8 %.)
There are currently 10 positions up over 25% of which 3 are up over 40%. These include Johnson & Johnson (JNJ) JP Morgan (JPM) and CBS (CBS) which are up 42, 48 & +48% respectively.
The winner for the year is still our largest position Boeing (BA) which has an unrealized return since inception of 98%.